All-In-One Trading Toolkit [wjdtks255]Title: All-In-One Trading Toolkit
Description: This professional toolkit integrates 5 essential indicators into one seamless interface to enhance your market analysis. It provides a comprehensive view of trend, momentum, and volatility.
Features:
Bollinger Bands: Tracks price volatility and potential reversal zones.
Ichimoku Cloud: Visualizes long-term trend support and resistance.
RSI Dashboard: Real-time momentum monitoring in the top-right corner.
MACD Signals: Direct Buy/Sell shape indicators on the chart for instant decision making.
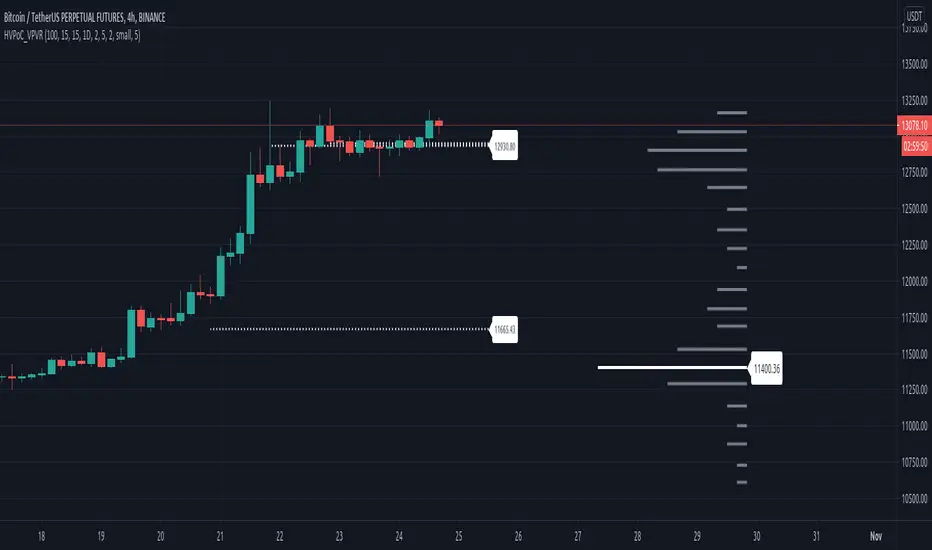
Volume Profile: Identifies key price levels with high trading activity.
Strategy:
Entry: Follow the MACD crossover signals (Green/Red triangles) when they align with the Ichimoku Cloud direction.
Penunjuk Pine Script®